Creating Target Meter
Creating Target Meter
Target meter lets you set and monitor targets for your sales team. You can view the number of leads generated in the current year, annual revenue for last quarter, or sales target achieved in the past few months. You will not have to run through a pile of reports to get this information, all you need to do is choose a target meter and define the relevant parameters and get the data.
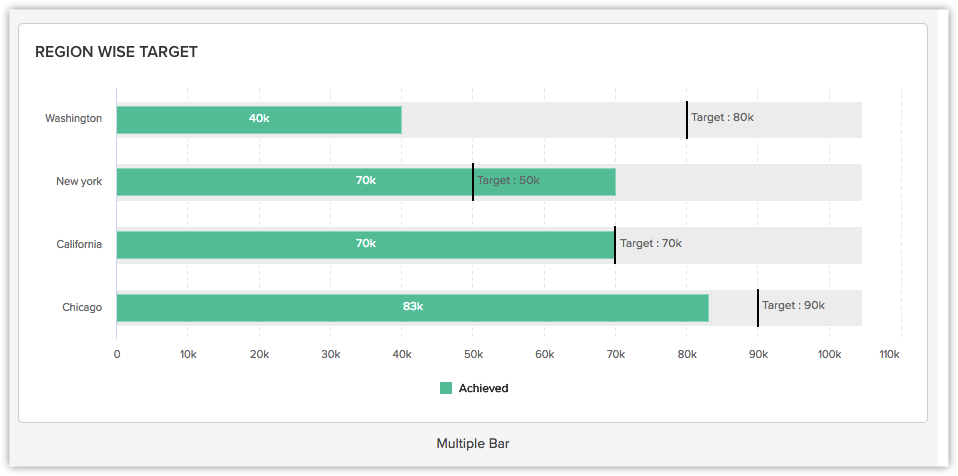
Let's take an example to understand this better. Say, Zylker Inc. wants to set targets for a period of six months for each region and keep track of any gap that may occur. They can choose the multi-bar target meter style and set the target for the sales manager's. In addition, they can also set individual targets for each sales manager in case the expected revenue varies region wise. This data will give a comprehensive and clearer picture of the target that was set for each region or individual and the target that was achieved.
Create a Target Meter
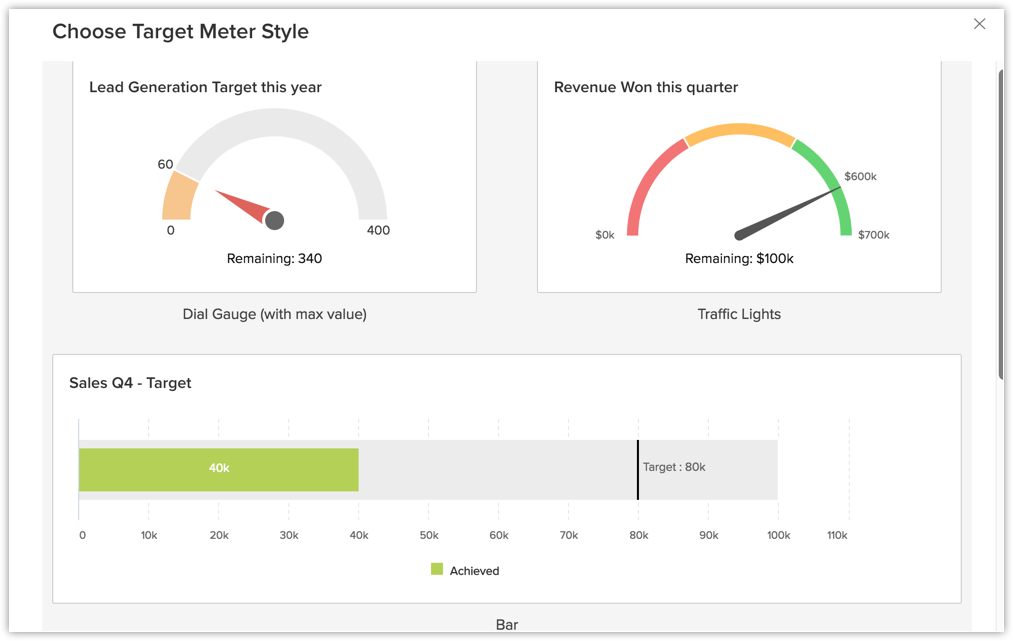
Based on your business requirement you can choose from 4 different types of Target Meters:
- Dial Gauge (with max value)
- Bar
- Multiple Bar
- Traffic Lights
To create a target meter
- Click the Dashboards tab.
- In the Dashboard Builder page, select the dashboard in which the Target Meter has to be added.
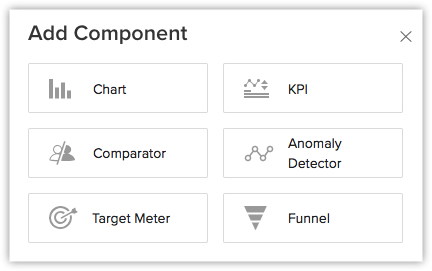
- Click Add Component.
- In the Add Component page, click the Target Meter.
- In the Add Target Meter page, click the desired Target Meter Style.
- In the next page, do the following:
- Enter the component name.
- Select the Set target for, Target metric and Duration from the drop-down list.
Click + Criteria filter to remove any data that should not be captured. - Specify the Target.
- Click Save to save the target meter in a dashboard.
Click Add & Reorder to add and rearrange the components.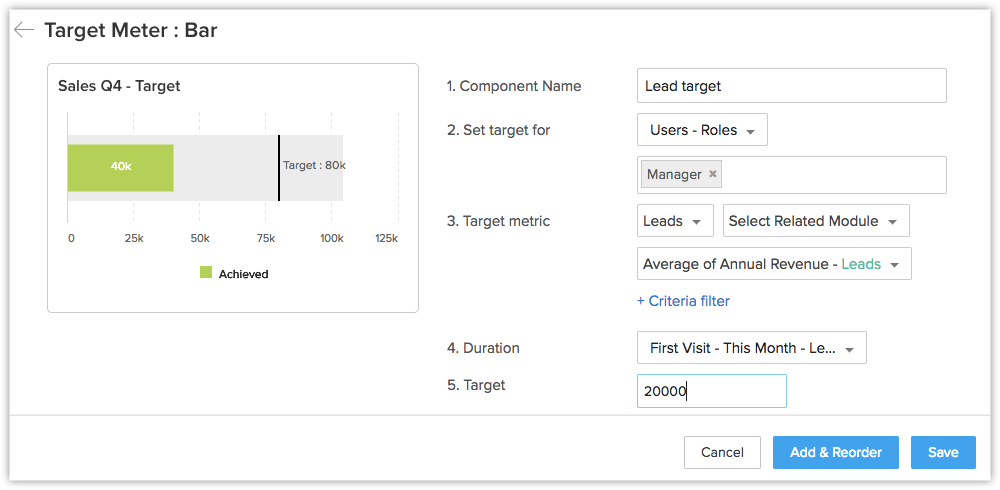

- In the Traffic lights target meter style, you can customise the target meter to denote whether the numbers are in safe zone, danger, etc.
- You can Edit, Delete, Print, Add to Home, Embed URL or Add a chart to favourite by clicking on the More icon in the component.
Related Articles
Creating Reporting Hierarchy
Creating Reporting Hierarchy Enable Reporting Hierarchy Assign Reporting Managers to Users View Reporting Hierarchy Delete a User Modify Reporting Hierarchy Share Record Data Within the Organization How Reporting Hierarchy Changes Associated CRM ...How to create Segments in Zoho Marketing Automation
Segmentation is a powerful tool that allows you to send targeted marketing messages to specific groups of contacts. In Zoho Marketing Automation, you can create segments based on a variety of criteria, including contact properties, campaign activity, ...Creating Profiles
Creating Profiles Profiles in CRM help you define permissions for a set of users. For instance, the permissions required for a person from Sales team might differ from the permissions required by a person in the Marketing team. You can define the ...Creating Funnels
Creating Funnels A funnel segregates the data based on different stages involved in your business process. For instance, a sales funnel can give you details like particular sales stages that you should concentrate on, stage-wise drop rate in lead ...Creating Charts
Creating Charts A chart presents data from various records of a module(s) in a visual or graphical representation for an easy analysis. The data is seemingly comprehensible as users can easily pick out the patterns, trends, etc., which may otherwise ...