Creating Dashboards
Creating Dashboards
Dashboard is a summarized view of the custom report data in the CRM. It provides a platform for a real-time analysis of the sales stages and business operations. You can create a dashboard and share it with all the users or few selected users. You can also create private dashboards that will be accessible only to you.
Availability
Permission Required
Users with Dashboard Tab and Manage Reports permission in their profile can access this feature.
Create Dashboard
Depending on your business requirement you can create dashboards to get an overview of varied business activities such as, email analytics, lead status, marketing metrics, activity stats and so on. Further, you can share these dashboards with selected or all users in your organisation.

Note
If you choose to share a dashboard with all the users in your organisation, the data will be visible even to those users who may not have the permission to view some fields.
To create a dashboard
- Click the Dashboards tab.
- In the Dashboards Home page, click the Add link.
- Click Add Component, to add different components to your dashboard.
- In the Dashboard Builder page, do the following:
- Enter the Dashboard Name.
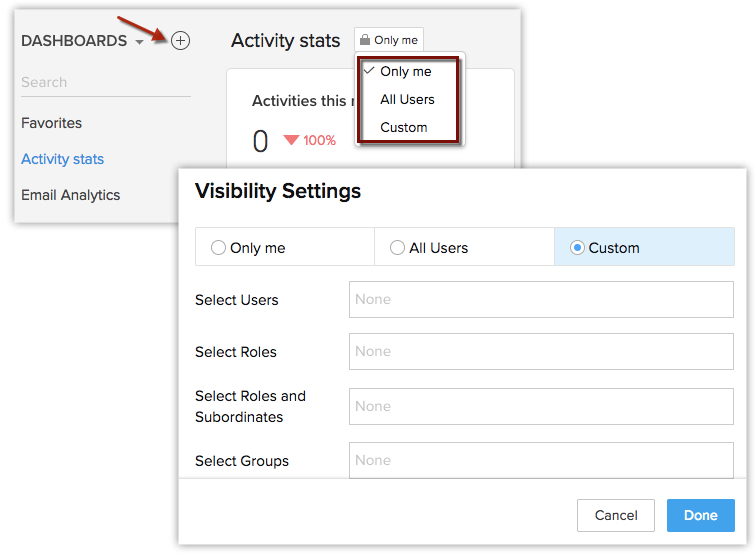
- Select the users with whom you want to share the dashboard.
- Only me - Accessible only to you.
- All users - Shared to all users in your CRM.
- Custom - Select users from different sources like list of users, roles & subordinates or groups.
- Click Save.
Drill Down Dashboards
You can view a detailed report on the selected data in any dashboard report.
To drill-down dashboards
- Click the Dashboards tab.
- In the Dashboards Home page, select the required dashboard.
- In the selected dashboard, click on the data for which you need a detailed report.
- The data is displayed in the form of a report.
- In the Report page, you can export the data to PDF/XLS/CSV, save the report, customise it, or create a chart based on the details.
Add to Home or Favourite
This feature allows you to add the chart to the home page of your CRM.
To add the chart to your home page
- Click the Dashboards tab.
- In the Dashboards Home page, select the required dashboard.
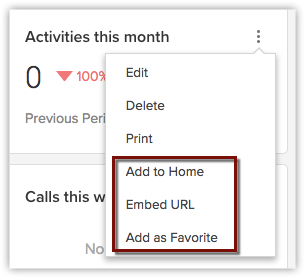
- Click the More icon and select Add to Home or Add as Favorite.
View Dashboards
The dashboards present in your CRM account for your organisation are categorised as follows:
- Favourites - Dashboards that you have marked as favourites. The dashboards can be reordered by clicking the reorder icon (
) at the bottom.
- Created by me - Custom dashboards created by you (the user).
- Shared with me - Custom dashboards explicitly shared with you by any user in your CRM account.
- Public - Dashboards that are accessible to everyone in your CRM account. This also includes the default dashboards provided by the CRM.
- Other user's dashboard - Custom Dashboards created by other users in your CRM account, which doesn't come under the above categories will be displayed. Only Admins and Super Admins will be able to see the dashboards created by other users.
Embed URL
You can embed the chart in any web page if requires. This can be done by copying the URL from the CRM and pasting it in the required site.
To embed the chart's URL
- Click the Dashboards tab.
- In the Dashboards Home page, select the required dashboard.
- Click the More icon and click Embed URL.
- From the Embed URL page, copy the URL from the copy URL text box.
- Enter the domains in which the chart should be displayed in the Enter allowed domains text box.
This chart will be visible only in the domains that is entered here. For example, if you copy paste the chart in a page with the domain .edu but this domain isn't specified in this text box, then the chart cannot be viewed in that webpage.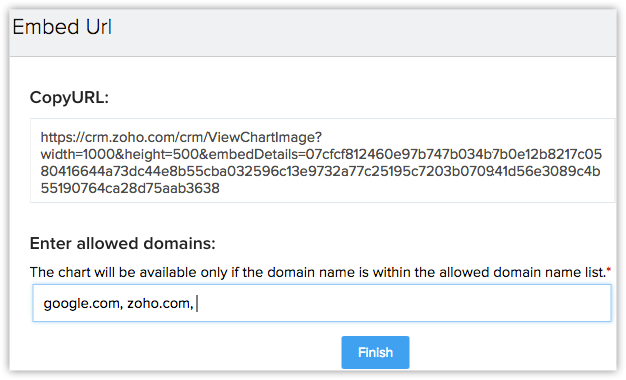
- Click Finish.
Related Articles
Creating Funnels
Creating Funnels A funnel segregates the data based on different stages involved in your business process. For instance, a sales funnel can give you details like particular sales stages that you should concentrate on, stage-wise drop rate in lead ...Creating Charts
Creating Charts A chart presents data from various records of a module(s) in a visual or graphical representation for an easy analysis. The data is seemingly comprehensible as users can easily pick out the patterns, trends, etc., which may otherwise ...Creating Comparator
Creating Comparator A Comparator lets you compare your organisation's data among users, roles and over different time periods. You can easily track information like sales teams performance over the years, number of deals lost or won in the ...Creating Anomaly Detector
Creating Anomaly Detector Anomaly detector, lets you define specific parameters to keep a watch on number of deal closures, average annual revenue generated or number of lead conversions and so on. In other words, any deviation from your usual sales ...Creating Target Meter
Creating Target Meter Target meter lets you set and monitor targets for your sales team. You can view the number of leads generated in the current year, annual revenue for last quarter, or sales target achieved in the past few months. You will not ...