Creating Anomaly Detector
Creating Anomaly Detector
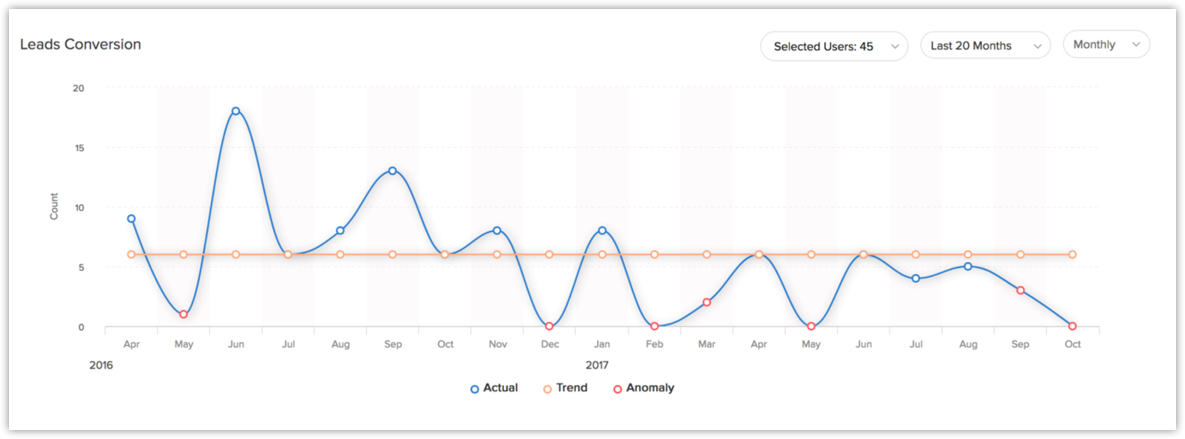
Anomaly detector, lets you define specific parameters to keep a watch on number of deal closures, average annual revenue generated or number of lead conversions and so on. In other words, any deviation from your usual sales pattern will be detected and notified for easy identification and quick action.
Say for example, you have not been able to monitor the deal closure pattern of your sales team for a while and suddenly notice a significant dip in the annual revenue. You need not go through pile of data to figure this out, anomaly detector will compare the actual deal closure pattern with the set sales metrics and show the anomaly at a defined period of time.
Create an Anomaly Detector
You can create an anomaly detector for both standard and custom modules.
To create an anomaly detector
- Click the Dashboards tab.
- In the Dashboard Builder page, select the dashboard in which the Anomaly detector has to be added.
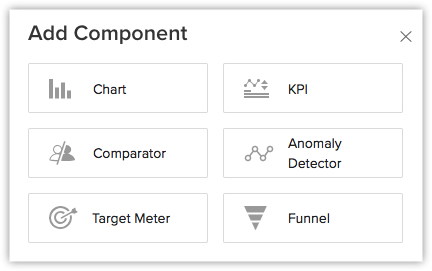
- Click Add Component.
- In the Add Component page, click the Anomaly Detector icon.
- In theAdd Anomaly Detector page, do the following:
- Enter the component name.
- In Detect Anomaly, select a Module from the drop-down list.
- In Associated Date Field select the time from the drop-down list.
Click +Criteria filter to remove any particular record.
- Click Save.
Click Add & Reorder to add and rearrange the component in dashboard.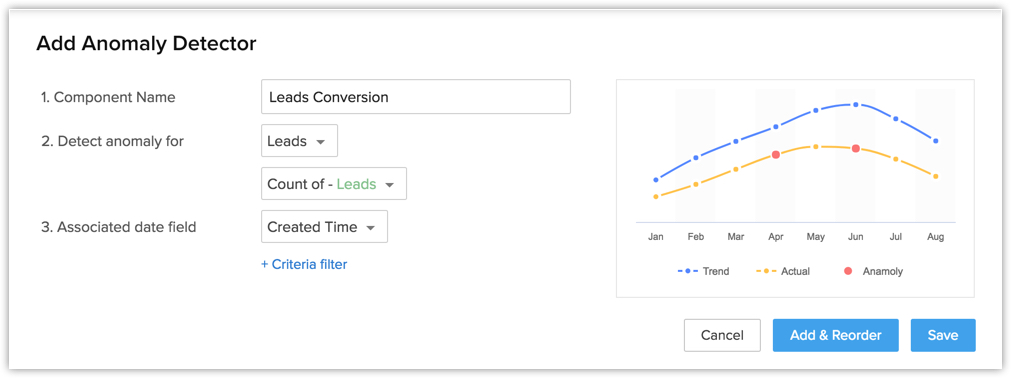

Related Articles
Creating Profiles
Creating Profiles Profiles in CRM help you define permissions for a set of users. For instance, the permissions required for a person from Sales team might differ from the permissions required by a person in the Marketing team. You can define the ...Creating Funnels
Creating Funnels A funnel segregates the data based on different stages involved in your business process. For instance, a sales funnel can give you details like particular sales stages that you should concentrate on, stage-wise drop rate in lead ...Creating Charts
Creating Charts A chart presents data from various records of a module(s) in a visual or graphical representation for an easy analysis. The data is seemingly comprehensible as users can easily pick out the patterns, trends, etc., which may otherwise ...Creating Comparator
Creating Comparator A Comparator lets you compare your organisation's data among users, roles and over different time periods. You can easily track information like sales teams performance over the years, number of deals lost or won in the ...Creating Vendors
Creating Vendors In the CRM, you can create vendors by: Entering data in the vendor details form: You can manually fill in the Vendor details in the form. Importing vendors from external sources: You can gather data through various sources and import ...