Analytical Components in a Dashboard
Analytical Components in a Dashboard
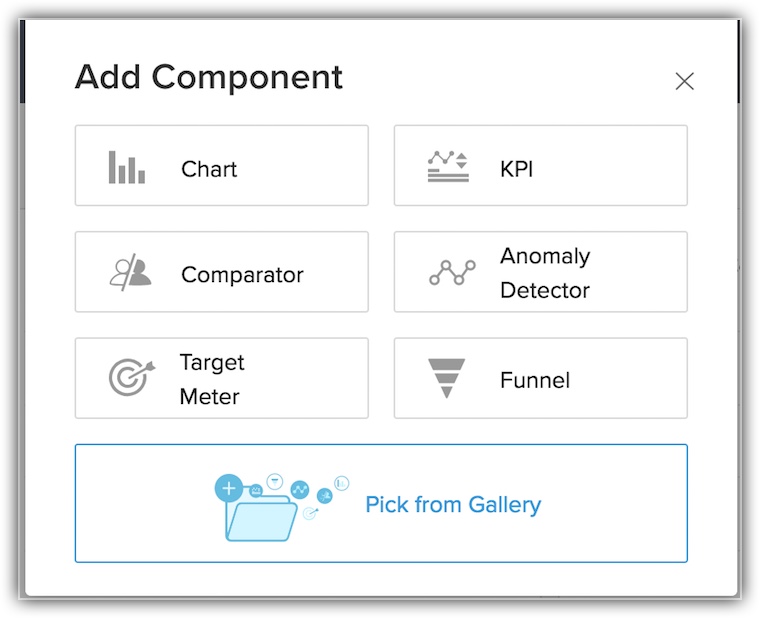
Analytical components display your organisation's data in a pictorial form making it more comprehensible. The CRM provides six different types of analytical components for your dashboards. Below are the list of components you can choose from:
- Chart - Chart is a graphical representation of your data. It gives a quick insight of the records for an easy analysis.
- KPI - Key Performance Indicator lets you measure the performance of your team.
- Comparator - Comparator gives you a comparative overview of any data like user performance, lead source etc.
- Anomaly Detector - Anomaly Detector detects any type of discrepancy in your usual business process.
- Target Meter - Target meter lets you set and monitor targets for your team.
- Funnel - Funnel provides you a visual depiction of different stages in your business.
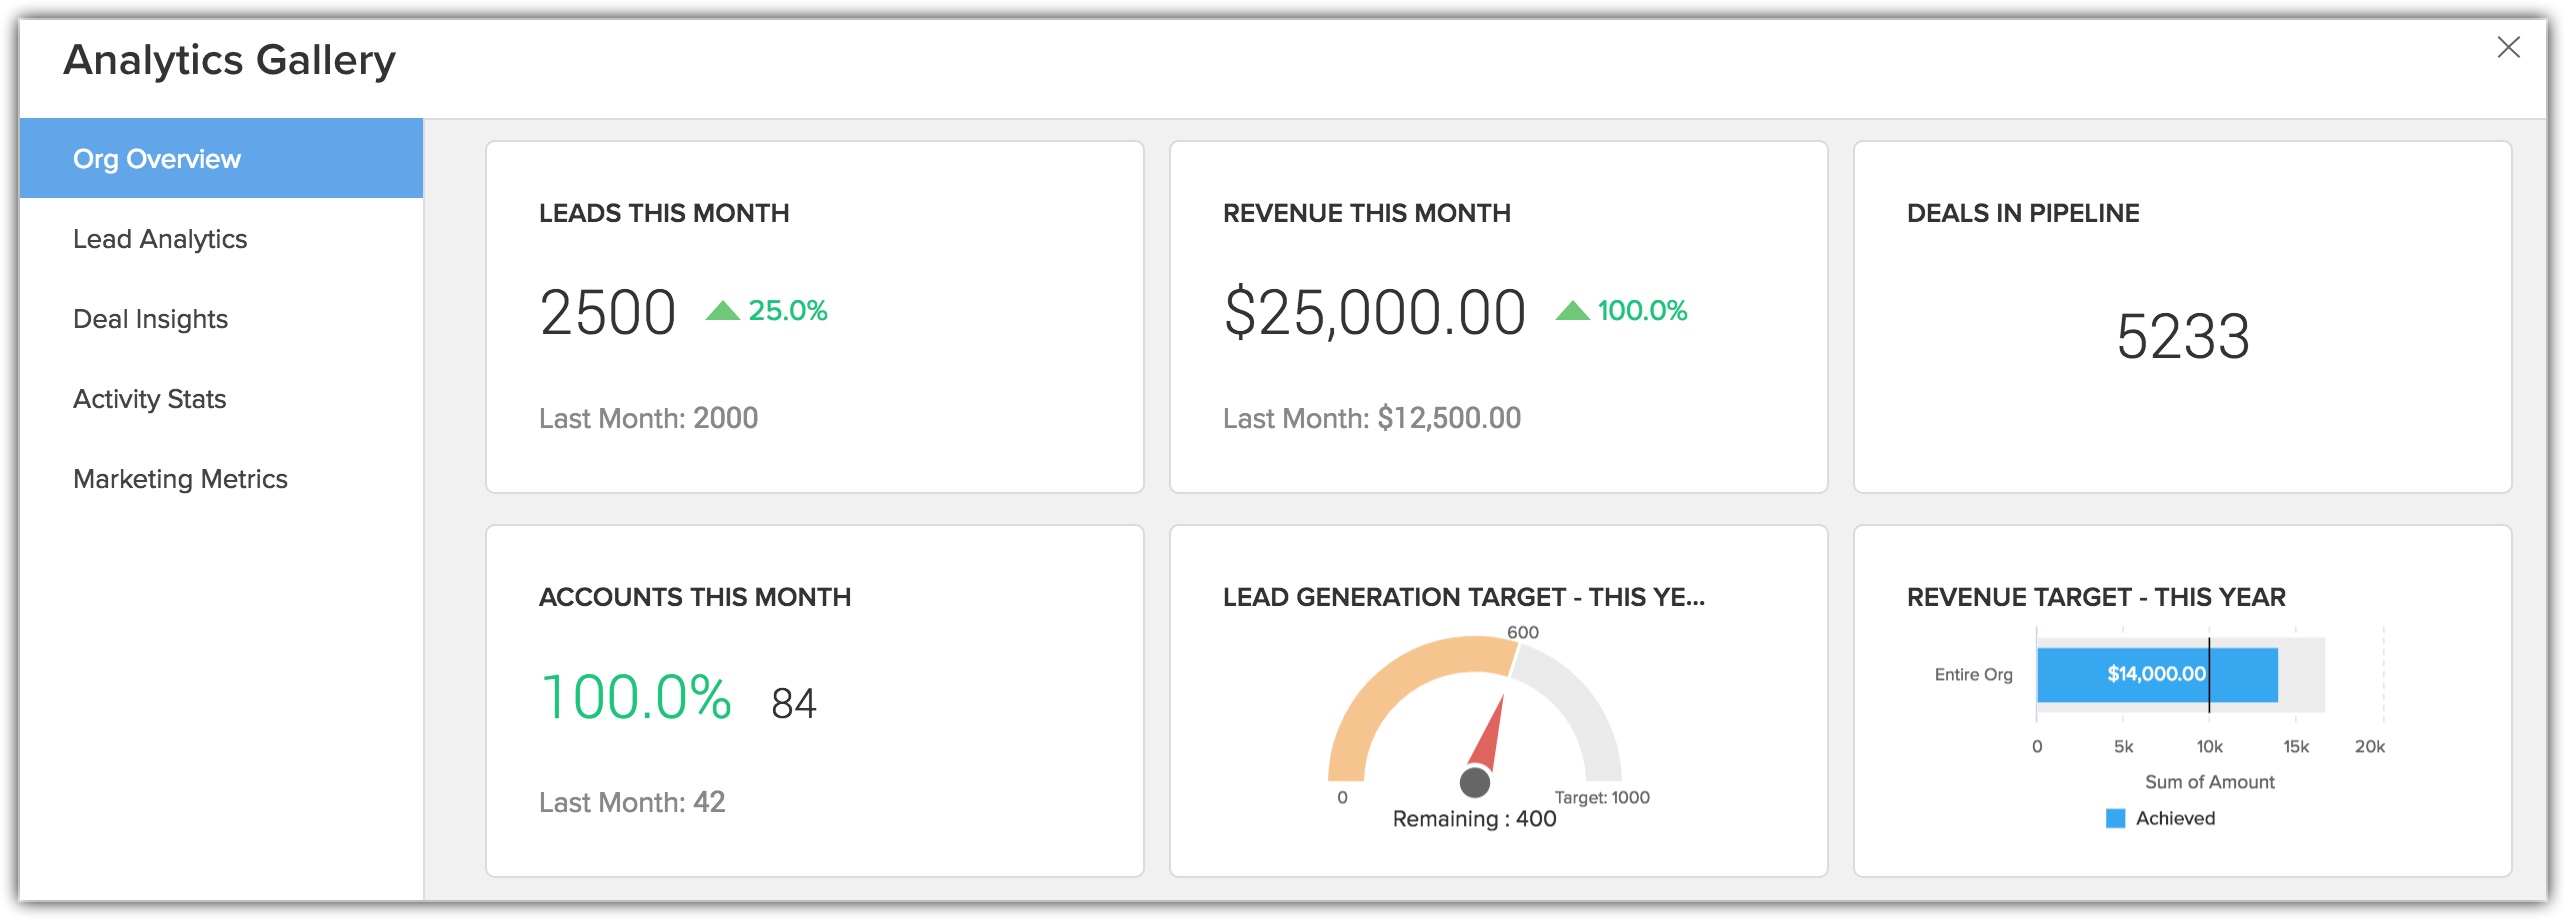
You can also choose to add components from the Analytics Gallery page. All you need to do is, click the Pick From Gallery option in Add component and select a component from the gallery.

Note
- You can add maximum 10 components to a dashboard.
- Only Summary and Matrix reports can be added to the dashboard.
- You can delete only those custom charts that are created by you.
Related Articles
Analytical Dashboards
Analytical Dashboards Every business requires processing and organising huge amount of data on a day-to-day basis. Also, your daily activities can become tedious when you have to get regular updates on trends, targets, performance indicators, ...Creating Dashboards
Creating Dashboards Create Dashboard Drill Down Dashboards Add to Home or Favourite View Dashboards Embed URL Dashboard is a summarized view of the custom report data in the CRM. It provides a platform for a real-time analysis of the sales stages and ...Customising the Home Tab
Customising the Home Tab Classic View User's Home Page Customized Home Page Switch between the Classic View, User's Home Page and Customized Home Page Create Customized Home Page Add Components in User's Home Page View Recent Items Check Reminders ...Explore Your Account
Explore your Account Home Tab Module View Record View Setup Page Take a screen tour to know your CRM display better. Home Tab When you open your CRM account, the first screen that you see is the home page. Here, you can take a quick glance at the ...Creating Charts
Creating Charts A chart presents data from various records of a module(s) in a visual or graphical representation for an easy analysis. The data is seemingly comprehensible as users can easily pick out the patterns, trends, etc., which may otherwise ...